Affinity Optimization
Affinity optimization aims to enhance the binding affinity between proteins. The change in affinity due to mutations is characterized by \(\Delta\Delta G_\text{bind}\), which relates to the dissociation constants \(K_\text{d}\) of the wild-type and mutant molecules.
From the equations above, we can see that the stronger the mutant binding affinity, the smaller \(K_\text{d}^\text{(mt)}\) is, and the more negative \(\Delta\Delta G_\text{bind}\) is.
Features
GearBind uses advanced pretrained geometric deep learning models to predict the impact of mutations on protein-protein affinity. It allows users to quickly evaluate a large number of mutants computationally and identify the most promising variants for experimental validation.
Mutation sites can be specified flexibly. For example, in antibody affinity maturation, you can target the CDR regions or all residues in contact with the antigen. You can also customize a list of multiple mutation sites. GearBind will predict the affinity changes due to mutations.
Inputs
To submit an Affinity Optimization job, open the Project Editor and click "New Job" button on the left sidebar. Then click "Affinity Optimization" under the "Affinity Optimization" group to open the job submission page.
- Complex: Choose any PDB or mmCIF file containing a protein-protein complex structure. If the file is already open in the structure viewer, click "Select from viewer". If the file is in your current project, click "Select from project". Otherwise, you can upload it in the Files & Jobs or import it from cloud databases like PDB.
- Ligand: Specify the chain ID(s) of the ligand (antibody), e.g., "H,L".
- Target: Specify the chain ID(s) of the target (antigen), e.g., "C".
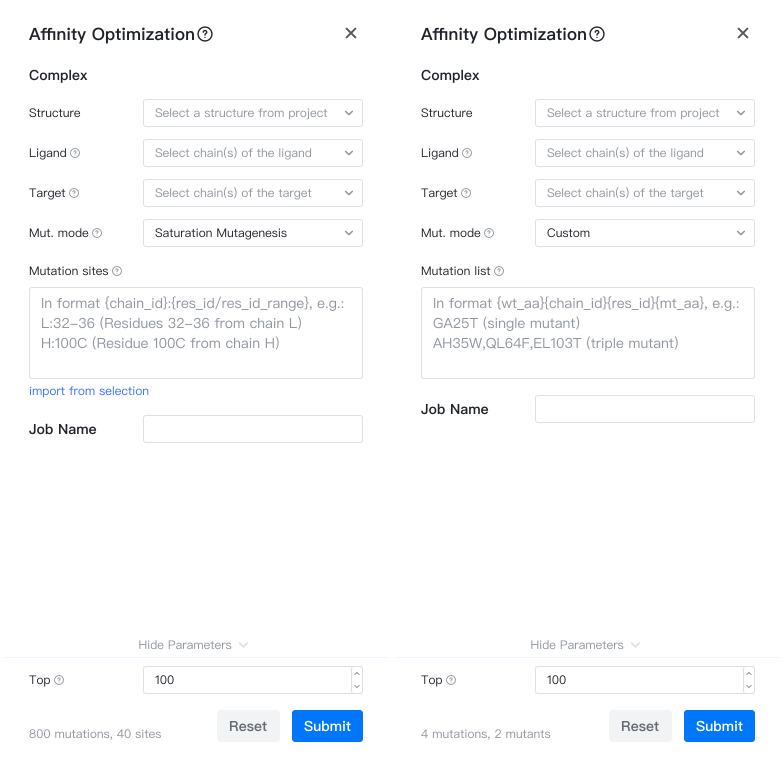
- Mut. mode: Two modes are available: saturation mutagenesis and custom mutations.
- Saturation mutagenesis: Predicts affinity changes for mutations to all 20 amino acids at selected sites.
- Custom: Define a custom list of mutations and predict affinity changes.
- Mutation Sites: In "saturation mutagenesis" mode, input the residues to be mutated in the format "chain:start-end", e.g., "H:100-112,L:50-60". See Mutation Site Format for details.
Import mutation sites from selection
Click the "Mutation Sites" input box and you will see "open file" or "import from selection" below the input box.
- If the input structure file is not opened in the Structure Viewer, you can click "open file" to open it.
- If the input structure file is already open in the Structure Viewer, you can enter Selection Mode and select mutation sites on the structure. Then click "import from selection" to automatically fill this input box.
- You can also run the Interface Visualization job, which will create components in the Structure Viewer. You can then select a component and click "import from selection" to automatically fill this input box.
- Mutation List: In "custom" mode, input the complete list of mutations, each line representing a mutant.
- pH: Specify the pH value of the system.
- Job Name: Name of the job. Note that the job name must be unique within the project.
Mutation Format
In GeoBiologics, the format for a single-point mutation is {wt_aa}{chain_id}{res_id}{mt_aa}, where:
- wt_aa
The single-letter amino acid name of the wild-type residue, e.g., S. - chain_id
The author-specified chain ID of the residue, e.g., H. - res_id
The author-specified residue ID, which may include insertion codes, e.g., 100, 100B. - mt_aa
The single-letter amino acid name of the mutated residue, e.g., Y.
For example, if you want to mutate the 100B residue (Chothia numbering may include insertion codes) on chain H from S to Y, the mutant representation is SH100BY.
A mutant may carry multiple mutations, separated by commas. For example, you may want to mutate the 100B residue on chain H from S to Y and the 50 residue on chain L from G to R. The mutation list is then SH100BY,GL50R.
Mutation Site Format
In GeoBiologics, the mutation site list comprises one or more "sites" and "fragments".
- Each site is represented as
{chain_id}:{res_id}, e.g.,H:100. - Each fragment is represented as
{chain_id}:{start_res_id}-{end_res_id}. For example,H:100-112. Note that the start and end residue IDs must not include insertion codes to avoid ambiguity. For example, certain antibodies may have the following IMGT numbering: "110 111 111A 112B 112A 112", in this case, if you specifyH:110-112, we will be unable to determine which residues you intend to mutate, so it is recommended to use site representation in this case.
Multiple sites or fragments are separated by commas or newlines. For example, H:100-110,H:111,H:111A,H:112B,L:50-60,L:92.
Note that all chain and residue IDs here are author-specified residue IDs and not label IDs.
Results
After creating the job, click the job name in the Files & Jobs panel to view the results.
The affinity optimization output includes the predicted affinity changes \(\Delta\Delta G_\text{bind}\) and the modeled mutant structures.
The main results are summarized in a table (summary.csv) with the following columns:
- mutation: Listed in order of predicted affinity improvement, format explained in Mutation Representation.
- mean_ddG: Predicted binding free energy change in kcal/mol. More negative values indicate stronger binding.
- 95% CI: 95% confidence interval of the predicted binding free energy change.
- You may click the "
 " icon on the right of each table row to view the original and mutant complex structures.
Mutation Suggestions
If the mutation mode selected is "saturation mutagenesis", the results page will also include a section "Per-residue scores", shows the top 5 amino acids recommended for each mutation site.
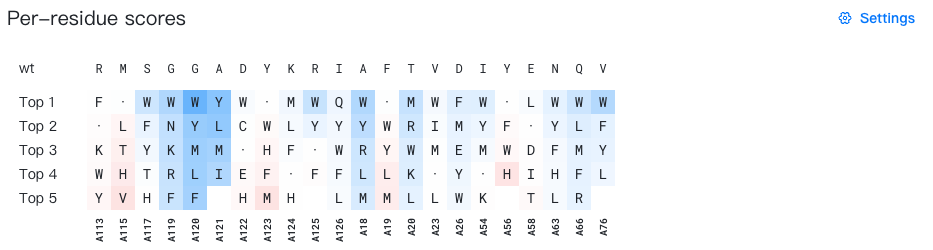
- The "wt" row shows the wild-type amino acid for each mutation site.
-
"Top 1-5" lists the top 5 recommended amino acids for each site.
Each cell displays a mutant amino acid type. Self-mutations are marked with "·" for easier identification. Mutations with low probability is hidden by default.
The background color of each cell shows the affinity advantage of the current mutation.
- In the "raw score" mode (the default mode), the binding-enhancing mutations are colored in blue, and the binding-weakening mutations are colored in red.
- In the "per-site probability" mode, the mutations with high per-site probability are colored in purple. Note that in this mode, probabilities across sites are not comparable.
When you hover over a cell, a tooltip (e.g. "A19 | F → Y | ΔΔG = −0.12 ± 0.11") will appear showing the wild-type and mutant amino acids, as well as the predicted \(\Delta\Delta G_\text{bind}\) value and its 95% confidence interval for the current mutation.
For a detailed documentation of this section, please refer to Mutation Advisor.
Suggestions for wet lab
Test 30+ single mutants in the first round, then combine beneficial mutations into multi-point mutants to find the best combination.
You may also build a mutant library by combining beneficial mutations, and perform library screening to find the best mutant.
Sources of error
- Complex structure: If the structure you provided is not accurate (e.g., predicted by an AI model), the predicted affinity changes may not be accurate.
- Affinity change predictor: The affinity change predictor is not 100% accurate. It works well on some protein-protein complexes but may work poorly on others.